


“What are the key mobile app metrics that I should track?”
This question rings in every app marketer’s head.
There’s fierce competition amongst apps, with 2 out of 3 apps failing to monetise. According to Gartner’s report in 2014, less than 0.01% of consumer mobile apps are considered a financial success by their developers.
As of the third quarter of 2019, there are approx. 2.47 million apps in the Google Play app store and around 1.8 million available apps for iOS in the Apple’s app store. Imagine the competition!
Having a killer product and a perfect mobile marketing strategy won’t make your app profitable. While it may not guarantee you success, but it definitely indicates a good start to the challenging journey of making your app successful.
App marketers – like you – need to now turn your focus towards app performance. Keeping a tab on the apps’ performance and measuring it allows you to pivot your growth strategy that’ll lead to success. Knowing what to change and when to change is the cornerstone of consistently driving your app in the right direction.
As a mobile marketer it is key to maintain the relationship between you and your user. Knowing the right formulae and the key mobile app metrics will help you in measuring the efforts you put in nurturing your app audience.
To make sure you track the app metrics that actually matter we’ve developed a handbook that will help you measure, track, and gauge all the critical app metrics at every stage of the app user lifecycle.
These include the following:
- User Acquisition Metrics
- User Activation Metrics
- User Engagement Metrics
- User Retention Metrics
1. User Acquisition Metrics
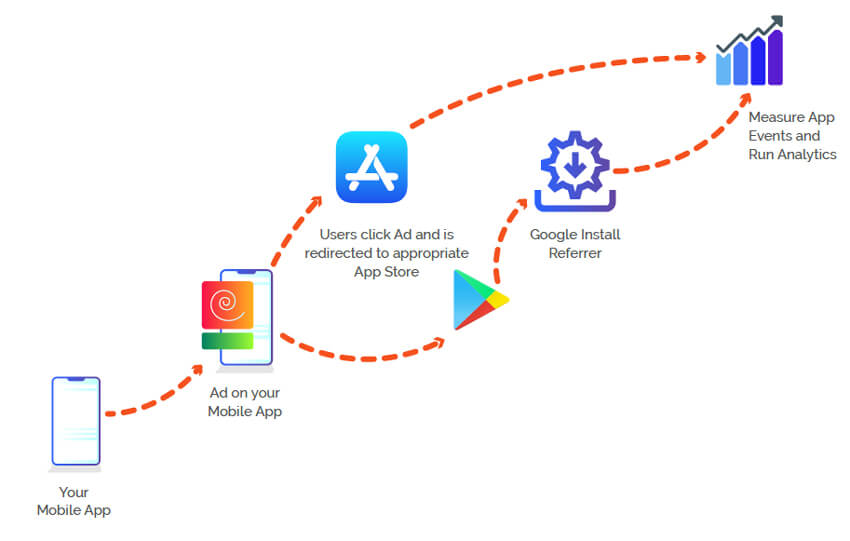
For your app to grow, you have to focus on and manage your acquisition channels. Measuring the acquisition will help you track which campaigns and channels (Organic vs. Paid) result in the highest number of valuable users in the long run.
- New Downloads: The total number of new downloads in a specific time period (daily, weekly, or monthly).
- Cost per Install (CPI): Cost per install is the total cost incurred by your business to acquire a new user through paid advertisements. This metric takes only paid installs into consideration.

Cost Per Install is a more specific metric for Customer Acquisition Cost (CAC) and helps in determining the vitality and dependability of your paid advertisements.
- App Download Attribution: It is important to attribute the downloads to its respective channel. You need to know where your users are coming from and optimise the one that consistently gets you more users. Using this data, a mobile marketer – like you – will be able to optimise the ROI from the ad campaigns.
Tracking these metrics on a daily or monthly basis will illuminate the success and the mileage of your marketing campaigns.
For example, if a $7,000 Facebook campaign spend gets you 150 new downloads over 4 weeks while the same spend on a Twitter campaign gets you 10X that in just 7 days, you’ll be able to make a more informed and data-backed decision the next time you run ad campaigns.
Tip: Turn your website visitors into app users by adding a “Download the App” button on your website. Doing this will lead the traffic from web to the app page and will increase the app downloads.
Also Read – User Acquisition 101: 7 Advanced Tips to Boost your App Installs
2. User Activation Metrics
You’ve run multiple campaigns and got users to install your app and the user acquisition skyrockets your user base. But what next? Did they launch it? Do they use your app? How would you nudge a user to start using your app?
While tracking the number of downloads is a good start, it won’t earn you attributable profits. Activation is another key metric for any app marketer. It is the most important pirate metric and tracking this metric will indicate the percentage of users who downloaded the app and actually launched it.

- App Activation Rate

- App Download to Launch Rate

For example, let’s say that your app has had 1000 downloads out of which 650 received app launches. Dividing 650 by 1000 would get you an activation rate of 65%. This rate can be even better provided you follow these strategies:
- Gamifying your activation process
- Enhanced user onboarding
- Incentivising activation with promo codes
- Offering access to exclusive in-app content
- This is also the stage at which you’re the first hurdle of your mobile marketing prowess is tested, i.e. seeking an explicit buy-in from your users to send them push notifications in the future.
Tip: Always ensure there’s a smooth user onboarding flow. Highlighting the key features of your app during the user onboarding will improve the activation rates.
3. User Engagement Metrics
User Engagement is done right when your users realise the actual value of your mobile app. Measuring the user engagement actions will illuminate the true value your app users gain.
Simply put, if a user is responding and performing key engagement actions then it indicates a good user engagement.

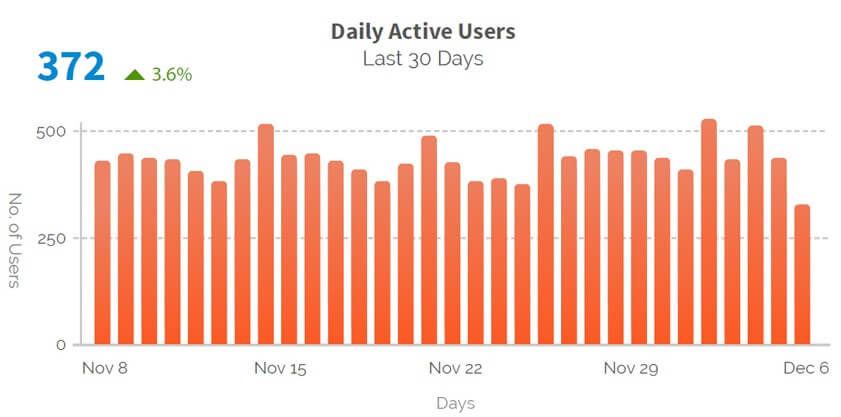
- Daily Active Users (DAU), Weekly Active Users (WAU), Monthly Active Users (MAU)
DAU is the percentage of users who take a particular action within your app. Gauging the success of your mobile app is one of the key aspects of your growth. It’s not about the daily users, it’s about the number of regular active users who create value to your business day in and day out. Use this metric to understand how your users experience the app.


DAU and MAU are directly related to app stickiness and are considered to be critical metrics for your app’s long-term growth.
- App Stickiness
Stickiness in mobile app marketing terms means how memorable, addictive, catchy, and useable the app is for any user. It gives you the total number of users or the percentage of users who are returning to your app month after month.

App Stickiness = DAU (Daily Active Users)/MAU (Monthly Active Users)
Understanding the user experience within the app and knowing what excites users to come back and use your app will ensure an increase in app stickiness over time. Tracking app engagement metrics will help you determine whether your users are performing key activities within your app, and the frequency of these activities.
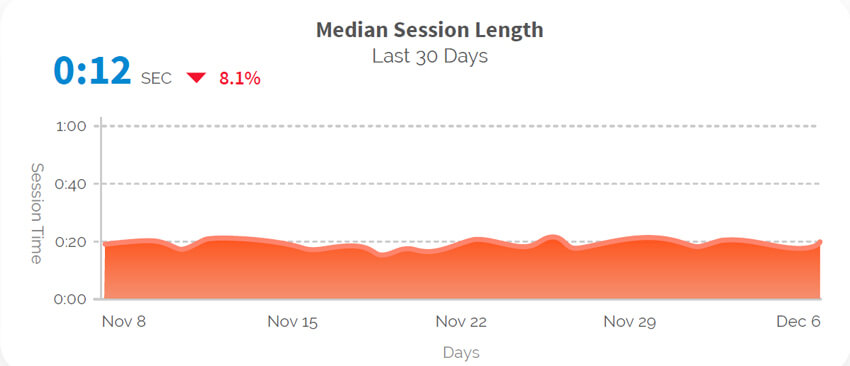
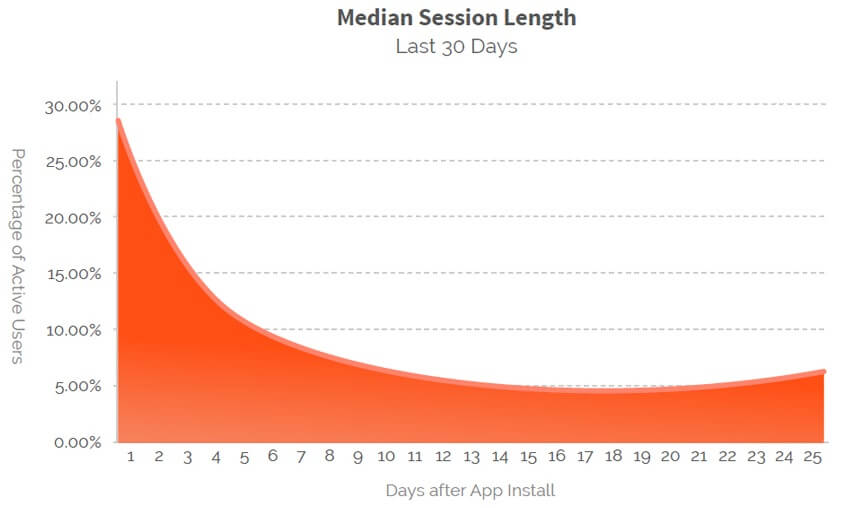
- App Session Length
Session length is the total time between app launch and closure by a user. It indicates how long a user spent within your app. Session length is the total time between app launch and closure by a user. It indicates how long a user spent within your app. In order to gauge how often a user launches your app and how long a user dives in you’d need to track daily and monthly app sessions for every active user.
- App Click-Through Rate
CTRs become an important metric when you engage through push notifications, in-app messages, emails, and ad campaigns. Measuring this will illuminate the impact of the engagement channel that is most effective.
Using this data, as a mobile marketer you can understand why a specific engagement channel doesn’t work and improve the CTRs of the channels that actually lag behind.
A heavy focus on mobile A/B testing and multivariate testing will help you hit upon high-conversion subject lines, message content, creatives, emojis, and CTAs for relevant campaigns across each channel.
All of this needs to take into account your users’ historical interactions with your app across multiple channels of engagement. Higher your CTRs, higher the chances of eventual conversions.
Tip: Send frequent and timely product updates with enhanced features and brand new content to keep your users engaged.
4. User Retention Metrics
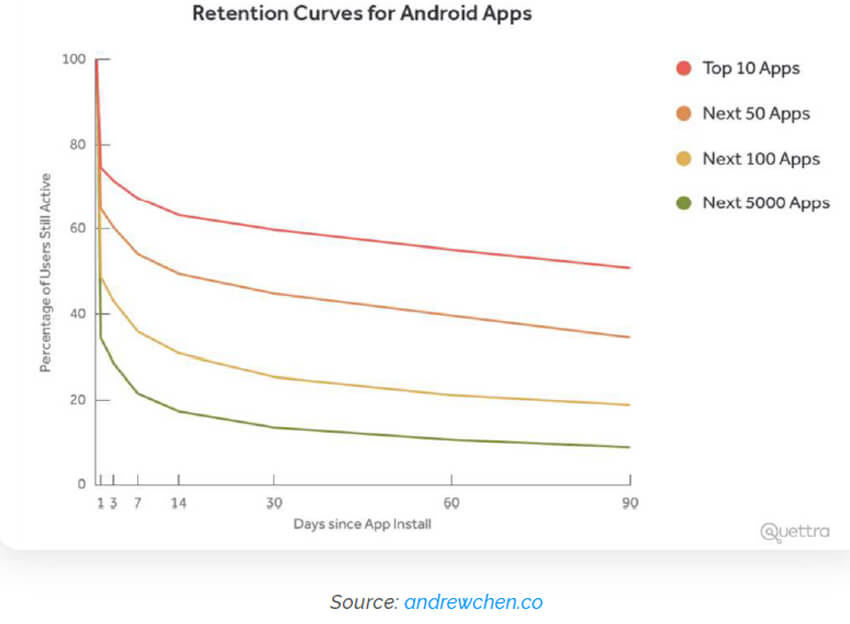
User retention has to be the north star metric for data driven marketers. According to Gartner, 80% of your future profits will come from just 20% of your existing users. For every user you retain your profit grows by 1%.
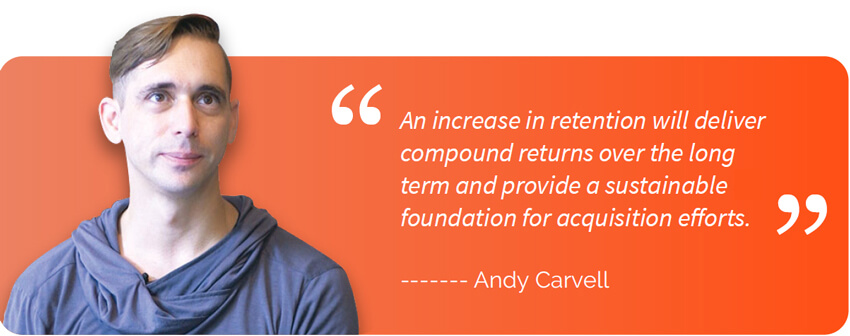
In fact, increasing user retention by just 5% can increase profits anywhere between 25% and 95%. While developing the product is a major focus area for most startups, having a strong customer success team is another key area of focus. The average app loses 77% of its daily active users (DAUs) within the first 3 days after install.
In order to maximise the outcome of your user retention efforts, you first need to understand which retention metrics to track and how to measure them. Once you have established them, you can begin to put them to work for lasting and profitable results.
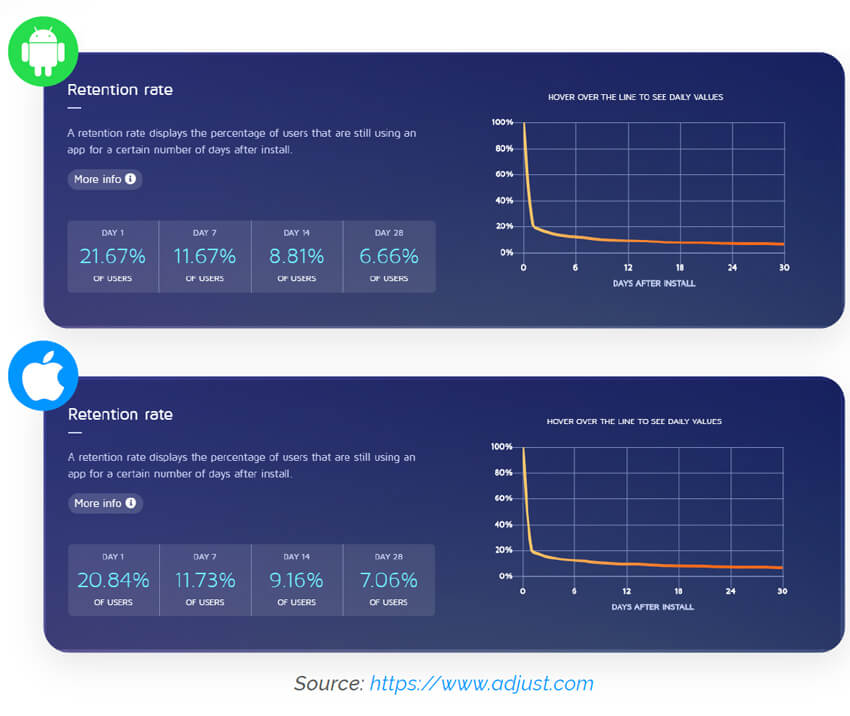
- App Retention Rate

Tracking and measuring retention rate over a period of 1, 7, or 30 days helps determine the apps’ longevity in the market. Retention rates gives you a bird’s eye view on what’s working and what needs improvement. It’s a continuous process that should begin after any significant changes in your app to reflect changes in user retention.
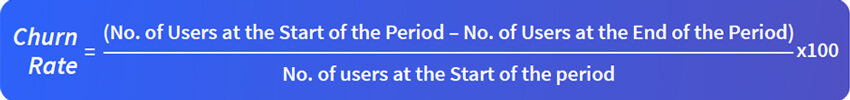
- App Churn Rate
Churn Rate is the number of users who have uninstalled your app or stopped using your app at any given period.
Also Read: Prevent Customer Churn with Smartech’s Automated Predictive Churn Model
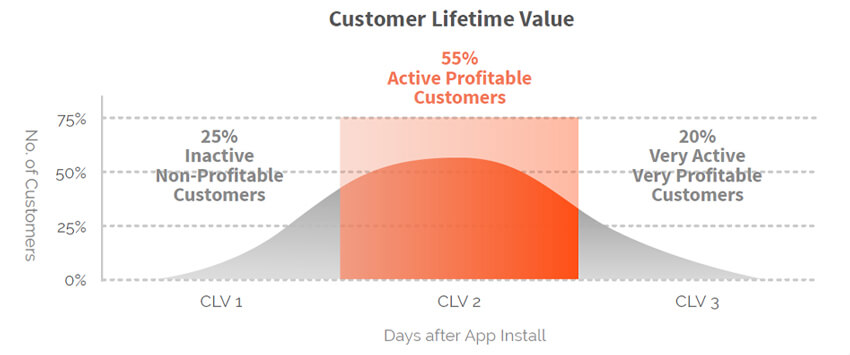
- Customer Lifetime Value (CLTV)
CLTV is one of the most important retention metric to track as it gives you the actual monetary value of the customer that you have gained. This helps in building an effective loyalty program to identify how much you should spend to retain your most valuable customers.

Tip: Focus on the abandoned cart users. A reminder push notification reminder within the 24 hours of cart abandonment can increase the conversion rates by 29%.
Retention Metrics Best Practices
Mobile app retention continues to bedevil mobile marketers, with a major chunk of app users abandoning the app within the first seven days or within a month of download. One of the key reasons for user churns is not enough value by the app to the user.
Two ways your app can warrant your users continuous usage; either be a first entrant by solving a critical problem or give enough value to the user to choose amongst the swarm of mobile apps.
It is surprising to know that 53% of smartphone users say they don’t have their favorite brand’s app installed on their phones. Continued use of your app will definitely improve the brand relationship between a user and a brand and they’ll eventually turn into loyal users.
So having a retention strategy is not just enough but tactically implementing it is the key to providing a seamless mobile user experience.
Once you introduce these retention tactics you can easily measure the metrics against these benchmarks to see how much impact you have had.
- Benchmark your app metrics
App user retention is a long term strategy. To measure your app performance, you need to know how many users did you start with and how many do you have at the moment.
- Measuring Customer Loyalty
Keeping a tab on all your retention tactics and strategies can be difficult at times. But this can be done using a rewards and loyalty program. Having a loyalty program is an effective way to improve your retention rates and enforce brand loyalty. One of the simple ways to measure customer loyalty is by calculating Net Promoter Score (NPS).

Mastering Mobile App Metrics
Become a mobile marketing ninja by mastering how to track and measure these key mobile app metrics at different app user lifecycle stages. Revenue is the most important metric when it comes to starting a business. In order to keep it consistent, you must adopt smarter and effective strategies to attract ever changing users’ interest. For best results, watch and track these metrics on a daily basis, to stay on top of things, optimise, and pivot your strategies whenever necessary.
Download the Ebook – Key Mobile App Metrics: A Handbook to Help You Become a Mobile Marketing Ninja

